


The health of a company's customer experience (CX), both CX operations and customer outcomes, is the quintessential indicator of a firm's adaptability and resilience over time. The firms that effectively align their culture, operating model (people, processes and technology) and financial goals with the interests of their most valuable current and target customers will position themselves to navigate market changes and lead innovation. In the face of persistent disruption and the challenges of the digital economy, an unwavering emphasis on and operational coordination of CX is not merely advantageous — it is existential. This article aims to share new measurement and diagnostic tools to efficiently boost CX effectiveness.
A Data-Driven Approach to CX
Leading customer experience-oriented firms are implementing measurement systems to foster agility. The integration of customer data and analytics into operational decision-making aims to enable firms to stay in step with, or even ahead of, shifts in market demands. These systems play a pivotal role in assessing CX effectiveness and directing adjustments to anticipate and meet evolving customer expectations. Through the strategic application of insights from CX metrics, companies can refine their offerings and significantly enhance customer satisfaction and loyalty. This data-driven approach to customer operations facilitates targeted resource allocation, prioritizing areas with the most substantial impact on business performance. Therefore, a steadfast commitment to measuring customer experience and adapting based on these insights is crucial for businesses that aspire to retain their market relevance and resilience — especially in the digital-first economy where data is the fuel.
How To Measure Customer Experience: The Evolving Landscape and Current Gaps
The evolution of customer experience health metrics can be traced back to the early days of market research when it became clear that the relationship between a brand and its customers extended beyond product quality. By the 1980s, with the ascent of service-centric industries, customer satisfaction became a focal point. The following decades witnessed a shift toward customer retention, during which metrics such as the Net Promoter Score (NPS) came to the fore. The digital revolution catalyzed the creation of more nuanced metrics that span the entire customer journey, leveraging technology and real-time feedback to refine CX measurement dynamically.
The most prevalent CX health metrics, as depicted in Figure 1, exhibit varying strengths and limitations across different contexts. Survey-based methods, which rely on attitudinal data, frequently encounter measurement issues such as response bias — where typically the dissatisfied customers are more inclined to provide feedback — and leniency effects in rating. Conversely, behavioral measures, though better predictors of financial outcomes than surveys, pose challenges due to their complexity and the high cost associated with analysis, implementation and maintenance. Even widely used survey programs can be cumbersome and resource-intensive to manage.
Furthermore, these metrics often fall short as robust predictors of financial growth at the corporate level and do not effectively facilitate benchmarking against competitors. They also inadequately capture the full range of consumer behaviors, especially in the digital arena where engagement with brands is increasingly prevalent and prolonged. This misalignment underscores a significant gap in current CX metric frameworks, highlighting the need for more comprehensive and integrated approaches to understand and predict the financial impact of CX initiatives.
Figure 1. Most Common CX Health Metrics
|
Metric |
Definition |
Strengths |
Weaknesses |
Complexity of Setup |
|---|---|---|---|---|
|
Net Promote Score |
Measures the likelihood of customers to recommend a company to others, reflecting customer loyalty. Customers are surveyed on a scale of 0–10. Promoters (9–10) minus Detractors (0–6) gives the NPS |
|
|
Low |
|
Customer Satisfaction |
Assesses customer satisfaction with a specific interaction or overall experience with a company. Surveys ask customers to rate their satisfaction on a scale, typically immediately after an interaction. |
|
|
Low |
|
Customer Effort Score |
Evaluates the effort required by a customer to get an issue resolved or complete a task. Customers rate the ease of their experience on a scale after an interaction, with lower scores indicating less effort. |
|
|
Moderate |
|
First Time Response |
The average time it takes for a customer support team to give the first response to a customer inquiry. Tracked via customer service software, calculated by dividing the total initial response times by the number of issues. |
|
|
Low–Moderate |
|
Average Handling Time |
The average time taken to fully resolve a customer's issue or request. Calculated by adding up all resolution times and dividing by the number of resolved tickets within a period. |
|
|
Moderate to High |
|
Churn Rate |
The percentage of customers who stop using a company's products or services over a specific period. For subscription services, it's the number of customers lost divided by the total number at the start of a period. |
|
|
Moderate |
|
Lifetime Value |
The predicted net profit attributed to the entire future relationship with a customer. Calculated using historical data on purchase frequency and spend, adjusted for customer retention rates. |
|
|
High |
A Novel Metric for Assessing the Health of Customer Experience
Business Necessity
The executive clients we speak to frequently possess an instinctive awareness of their organization's customer experience challenges, typically supported by operational data. Yet, they often lack objective metrics to validate the financial impact of their CX shortcomings on their market position. In fact, many executives find it challenging to convey the growing obsolescence of their existing CX strategies within an evermore digital marketplace, hindering their ability to secure investment for enhancing product and channel experiences tailored to the emerging demographic of digital-first consumers.
In response, we identified an urgent need for a rapid, cost-effective instrument to objectively gauge CX health relative to competitors within the digital arena, and to swiftly identify crucial levers for bolstering profitable growth. In the current economic climate, marked by budget constraints and inflationary pressures, businesses are increasingly seeking the most efficient methods to glean insights and identify the actions that will most significantly generate value. To meet this need, we crafted a customer experience metric intrinsically linked to a toolkit of expedited strategic intervention options poised to foster profitable growth.
The measurement function of our CX transformation toolkit is designed to address limitations of some of the traditional CX metrics by meeting these specifications:
- Economical and swift deployment, negating the necessity for intricate, bespoke data gathering and research initiatives
- An established indicator of financial outcomes rooted in behavioral data
- A reliable metric applicable at the enterprise level, enabling benchmarking against principal competitors
- An emphasis on digital CX engagement to accurately mirror prevailing and anticipated market movements
The aim is to provide a measurement with the precision organizations require to catalyze transformative shifts in business operations and steer companywide alignment toward the most critical CX imperatives.
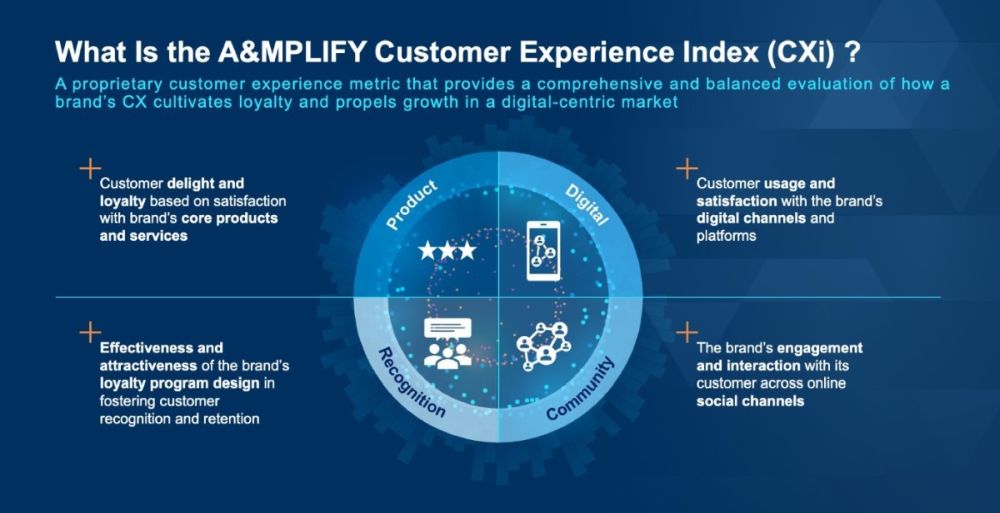
The A&MPLIFY Customer Experience Index
Introducing the A&MPLIFY CXi: the culmination of our research efforts to develop a customer experience metric tailored to client needs and business objectives. Integrating four crucial dimensions of brand engagement — product/service satisfaction, digital channel quality, recognition of loyal customers and engagement with the digital community — the CXi provides a comprehensive and balanced evaluation of how a brand's customer experience cultivates loyalty and propels profitable growth in a digital-centric market.
To explore the impact of digital customer behavior on revenue growth, as measured by the CXi, we implemented a rigorous statistical validation approach. This approach ensures that the CXi offers a reliable framework for brands to assess and enhance their customer engagement strategies in comparison to their competitors. By better understanding the relationship between CX and revenue growth, we are able to provide brands with actionable insights and targeted strategies proven to drive growth, competitive advantage and sustainable financial success.
Measurement and Validation
In our analysis of over 70 quick service restaurant (QSR) brands across the United States, we utilized correlation statistics and linear regression analysis to explore the validity of the CXi components' predicting average unit volume (AUV) growth (a store-level proxy for revenue CAGR). This detailed statistical examination can be found in Tables 1 and 2 below. In summary, we tested our model against real data using Kruskal-Wallis and the results did not show a statistically significant difference (H = 0.06, p = 0.80), signifying that our model is reliable for predicting real-world outcomes with the CXi compound metric. The CXi was found to be a statistically significant predictor of AUV CAGR and accounts for 58 percent of total CAGR variance (R2 = 0.583). We also normalized for certain model variables that bias toward larger brands (e.g., total number of Instagram followers), therefore ruling out any spurious correlations due to company size.
Table 1: Descriptive Statistics
|
Variable |
Operationalization |
Mean |
SD |
Min |
Max |
|
AUV CAGR |
Total unit volume revenue growth from 2021–2023 |
5.4% |
5.0% |
6.5% |
23.1% |
|
Product |
Customer ratings of product/service from online public channels (1–5 scale) |
2.9 |
0.3 |
1.9 |
4.1 |
|
Digital |
Customer app ratings from public channels (1–5 scale) |
4.6 |
0.6 |
2.1 |
4.9 |
|
Recognition |
A&MPLIFY digital loyalty program diagnostic (0–12 scale) |
7.0 |
3.0 |
3.0 |
12.0 |
|
Community |
Social media engagement (0–100 scale) |
10.8 |
15.7 |
0.0 |
100.0 |
Table 2: Model Fit
|
Metric |
Value |
|
R-squared |
0.583 |
|
Adjusted R-squared |
0.474 |
|
Mean Squared Error |
0.002 |
|
Kruskal-Wallis Test (P-value) |
0.800 |
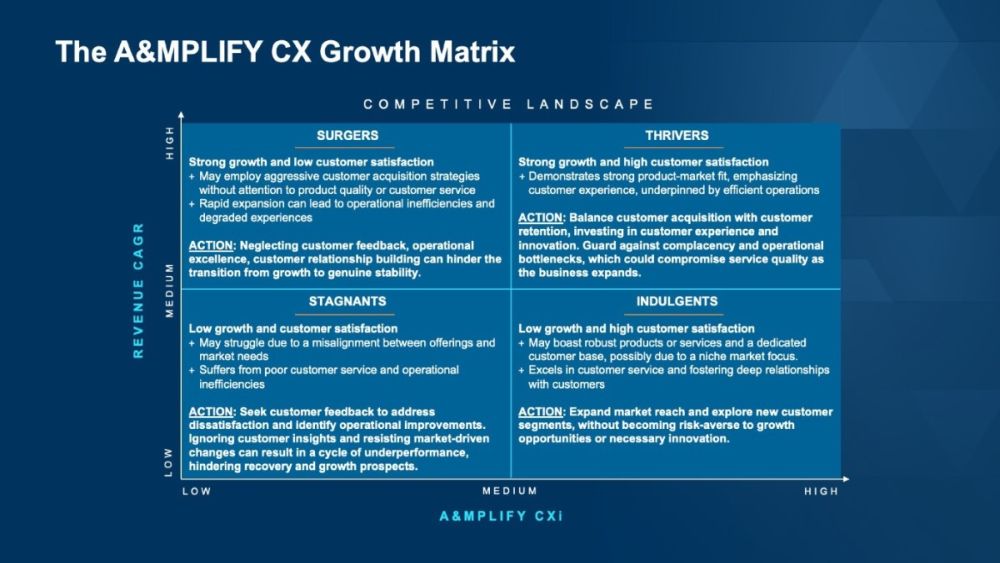
The A&MPLIFY CX Growth Matrix
The Customer Experience Index (CXi) is a strong predictor of revenue growth, explaining 58 percent of the variability (R-square of .583). However, the relationship between a company's customer experience and revenue growth is not a perfect linear relationship. Not all companies with strong customer experience scores exhibit growth, and conversely, some companies manage to grow despite a less positive customer experience. This variation underscores the complementary importance of the CX Growth Matrix (see Figure 2), which assesses both the current health of customer experience and aligns it with the strategic growth success of the company.
By plotting the CXi scores on the CX Growth Matrix, we identify four quadrants, each associated with specific strategic actions: marketing optimization, operational efficiency, growth development and workforce effectiveness. This framework not only provides a comprehensive view of an organization's performance but also offers tailored approaches for enhancing business outcomes. To validate the effectiveness of this matrix, we analyzed Quick Service Restaurant brands from our sample, incorporating both qualitative and operational data from client interactions and public sources. This methodology enables precise CX assessment and facilitates actionable strategies to foster growth.
Figure 2. A&MPLIFY CX Growth Matrix
Conclusion
The A&MPLIFY Customer Experience Index (CXi) addresses some of the key limitations of more traditional CX metrics with a multidimensional approach that more holistically captures customer engagement in the digital realm. Integral to this approach is the CX Growth Matrix, a strategic tool that aligns the CXi with revenue growth metrics to guide targeted business strategies.
Our analysis validates the CXi's predictive power for financial performance, endorsing its use for benchmarking and strategic decision-making. In the hands of today's business leaders, the CXi and the CX Growth Matrix are powerful allies, charting a course for customer-centric growth and competitive advantage. While the focus of our initial analysis was on the Quick Service Restaurant section, we believe the CXi model has broad applicability across other customer-facing industries including travel, hospitality, retail and others.
Originally Published 20 May 2024
The content of this article is intended to provide a general guide to the subject matter. Specialist advice should be sought about your specific circumstances.