

Seyfarth Synopsis: Plaintiffs continue filing ADA Title III lawsuits in record numbers with no sign of stopping.
As regular readers of this blog know, the number of ADA Title III lawsuits filed in federal court in 2020 dipped slightly under 11,000, but the plaintiffs' bar came roaring back in 2021. There were at least 11,452 federal filings last year - an all-time record since we started keeping track in 2013 when there were only 2,722 suits. That's a 320% increase in eight years.
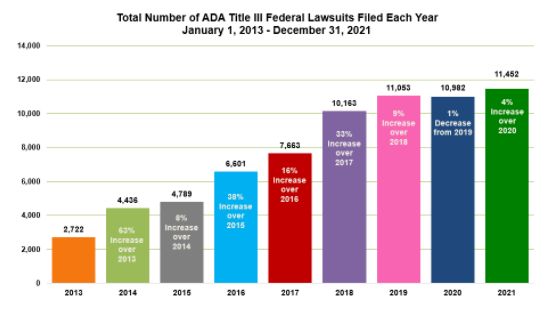
[Total Number of ADA Title III Federal Lawsuits Filed Each Year January 1, 2013 - December 31, 2021: 2013: 2,722; 2014: 4,436 63% increase over 2013; 2015: 4,789 8% increase over 2014; 2016: 6,601 38% increase over 2015; 2017: 7,663 16% increase over 2016; 2018: 10,163 33% increase over 2017; 2019: 11,053 9% increase over 2018; 2020: 10,982 1% decrease from 2019; 2021: 11,452 4% increase over 2020]
Has the world become more inaccessible? We don't think physical facilities are any less accessible than they were in 2013. If anything, they should be more accessible as new buildings built in compliance with the ADA Standards for Accessible Design replace old ones and more time has passed for businesses to engage in readily achievable barrier removal in pre-ADA facilities. So what is driving these huge numbers? We haven't finished our tally for 2021 but we know that in 2020, more than 2,500 lawsuits were filed in federal court about the accessibility of websites - a type of lawsuit that was rare to non-existent back in 2013. In addition, in 2021, a number of firms filed dozens, if not hundreds, of cookie-cutter website accessibility lawsuits. Plaintiffs' lawyers also filed hundreds of lawsuits on a new theory that that hotels violated the ADA by failing to disclose sufficient information about their accessible rooms on reservations websites. One firm filed over 550 of these cases starting at the end of 2020 and continuing through 2021. And, of course, the cases alleging physical access barriers in facilities such as shopping centers, restaurants, and hotels keep on coming - even in 2020-21 when indoor activities were often shut-down.
What do the numbers tell us?
California remains a lawsuit hotbed, no doubt because plaintiffs can add a state law discrimination claim under the Unruh Act and get $4,000 in statutory damages for every incident of discrimination without even having to prove an actual injury. The 5,930 California filings accounted for just over half the total number of filings nationwide. New York was a distant second, with 2,774 lawsuits, and Florida was third, with only 1,054 lawsuits. In short, there were more ADA Title III suits filed in California than in all other 49 states combined.
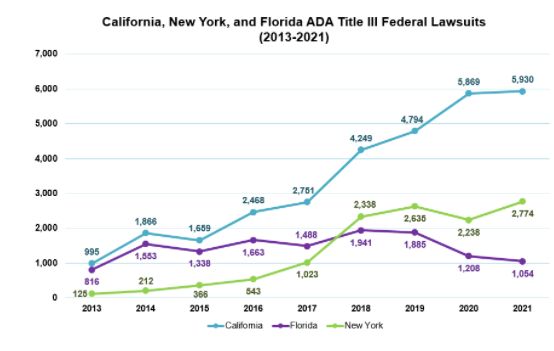
[California, New York, Florida ADA Tile III Federal Lawsuits 2013-2021: California: 2013: 995; 2014 1,866; 2015: 1,659; 2016: 2,458; 2017: 2,751; 2018: 4,249; 2019: 4,794; 2020: 5,869; 2021: 5,930; Florida: 2013: 816; 2014: 1,553; 2015: 1,338; 2016:1,663; 2017: 1,488; 2018: 1,941; 2019: 1,885; 2020: 1,208; 2021: 1,054; New York: 2013: 125; 2014: 212; 2015: 366; 2016: 543; 2017: 1,023; 2018: 2,338; 2019: 2,635; 2020: 2,238; 2021: 2,774]
Rounding out the top ten were Texas (337), Pennsylvania (161), Georgia (160), Nevada (130), Colorado (102), Illinois (99), and Tennessee (91). Nevada and Tennessee are newcomers to the top ten, displacing New Jersey and Massachusetts which fell to eleventh and thirteenth places with 70 and 51 lawsuits, respectively.
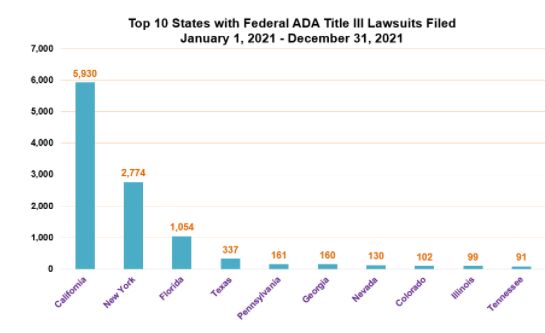
[Top 10 States with Federal ADA Title III Lawsuits Filed January 1, 2021 - December 31, 2021: California: 5, 930; New York: 2,774; Florida: 1,054; Texas: 337; Pennsylvania: 161; Georgia: 160; Nevada: 130; Colorado: 102; Illinois: 99; Tennessee: 91]
There were no ADA Title III federal lawsuits at all in Alaska, Delaware, Idaho, Iowa, Montana, Nebraska, and North Dakota.
March and November 2021 were the busiest months for new filings with 1,108 and 1,148 cases, respectively, while July and December 2021 were the least busy filing months with 743 and 732 filings. Even plaintiffs' lawyers have to go on vacation and celebrate the holidays, it seems.
image
[Total Number of Federal ADA Title III Lawsuits Filed Per Month January 1, 2021 - December 31, 2021: January: 1,108; February: 994; March: 1,240; April: 1,018; May: 1,003; June: 941; July: 743; August: 864; September: 836; October: 825; November: 1,148; December: 732]
We predict 2022 will be comparable to 2021 unless there is another COVID-related shutdown, but that seems unlikely at this point. Plus, ADA Title III lawyers have adapted to working remotely and are more productive than ever.
A note on our methodology: Our research involved a painstaking manual process of going through all federal cases that were coded as "ADA-Other," manually culling out the ADA Title II cases in which the defendants are state and local governments, and categorizing them by state. The manual process means there is the small possibility of human error.
The content of this article is intended to provide a general guide to the subject matter. Specialist advice should be sought about your specific circumstances.