


This paper analyzes the deal terms of 83 financings for unicorn companies that raised money in 2017 and the first half of 2018. The deals we analyzed are for U.S.-based, venture-backed companies that are privately held and valued at $1 billion or more, so-called unicorns. It also includes comparative data from our prior research covering unicorn financings in 2014-2016. Our prior research is available on www.fenwick.com (here, here and here). We have provided both quarterly and annual information, but bear in mind that the quarterly sample size is necessarily smaller, and accordingly more subject to being affected by an outlier financing.
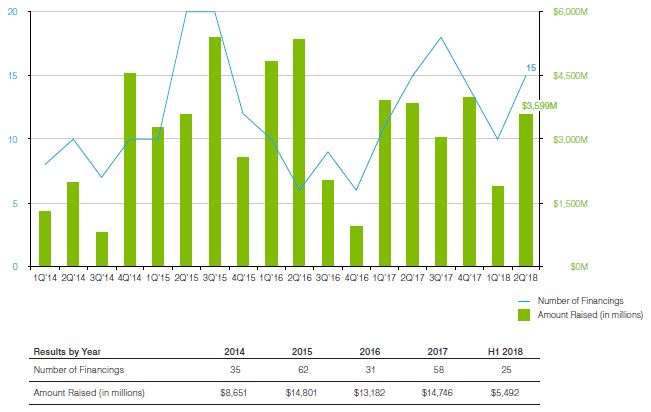
Number of Financings and Amount Raised
Much like the broader venture capital market, unicorn financing activity rebounded in 2017 from depressed 2016 levels. Nearly $15 billion was invested into unicorns across 58 financings, reflecting a year-over-year increase of 12% and 87%, respectively. Through the first half of 2018, deal volume is on pace to match 2017 levels; however, the amount of capital raised in these financings has declined.
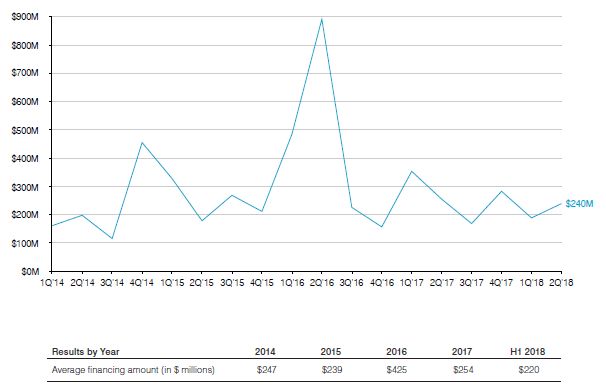
Average Financing Amount
U.S. venture deals continued to grow in size, with an increasing concentration of investment dollars into a fewer number of companies. However, the average amount of capital raised in unicorn financings decreased in 2017 compared to 2016 when several fundings over $1 billion contributed to a spike in the average financing amount. The average financing amount has continued to decline in H1 2018.
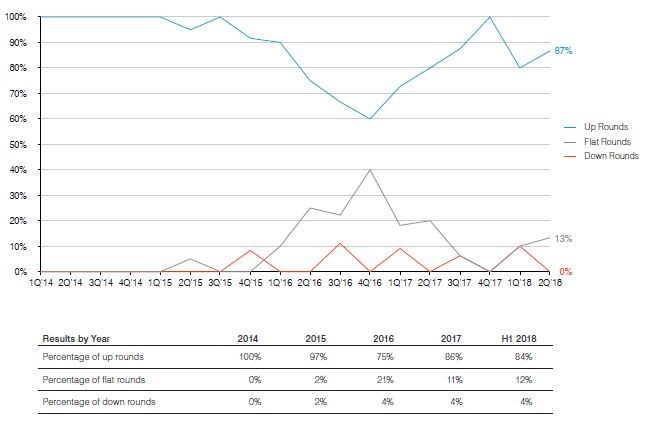
Direction of Price Change from Prior Round of Financing
The percentage of up rounds increased throughout 2017 after five consecutive quarters of decline beginning in Q4 2015. Still, the percentage of up rounds in 2017 and H1 2018, while higher than in 2016, remains below 2014 and 2015 levels. Almost all of the financings that were not up rounds were flat rounds and there continue to be very few down rounds.
To view the full article, please click here
The content of this article is intended to provide a general guide to the subject matter. Specialist advice should be sought about your specific circumstances.