

Earlier this year, Hitachi Rail published a white paper entitled "Better Connected: Global attitudes to Smart Public Transport". The white paper sought input from 8,000 respondents, based across 8 cities (London, Paris, Turin, Düsseldorf, Toronto, Washington, Bangkok and Dubai), about their use, and perspective of, different transport modes.
In a time of ever-increasing pressure to improve public transport, to facilitate global decarbonisation objectives, the report provides insight, on a global scale, as to how we view public transport. In this article I provide my own take on the white paper, draw my own conclusions, and identify ways in which innovators can learn from the ever-evolving public perspective of public transport.
Turning to the report: firstly, and perhaps not unsurprisingly, respondents were asked how they choose to commute. The data is broken down by city and is compared to a global average (see Figure 1, below.) Interestingly, the report notes that, except for London and Dubai, driving is the primary form of commuter transport across all of the cities considered. Based upon this fact alone, it is clear to see the challenge faced by governments and innovators alike in encouraging commuters to use public transport as opposed to their own vehicles. Also observed is a comparatively low proportion of commuters driving, and relatively high rates of public transport use, in Dubai in comparison to, for the most part, other cities. This could suggest that comparatively younger cities, where infrastructure has perhaps been planned with more of a public transport focus, provide for an improved public transport user experience. That said, there could, of course, be other factors at play (e.g. economic, city size, location of residential areas with respect to the city etc.). Also notable is the significant difference in different transport varieties preferred by respondents from the various cities. This creates a challenge, again for both governments and innovators, in providing greener transport solutions which will work on a global basis. Driving rates in London are comparatively low, with bus and train use comparatively high, at least provisionally suggesting that, compared to other cities, London faces slightly less of a challenge in this respect.
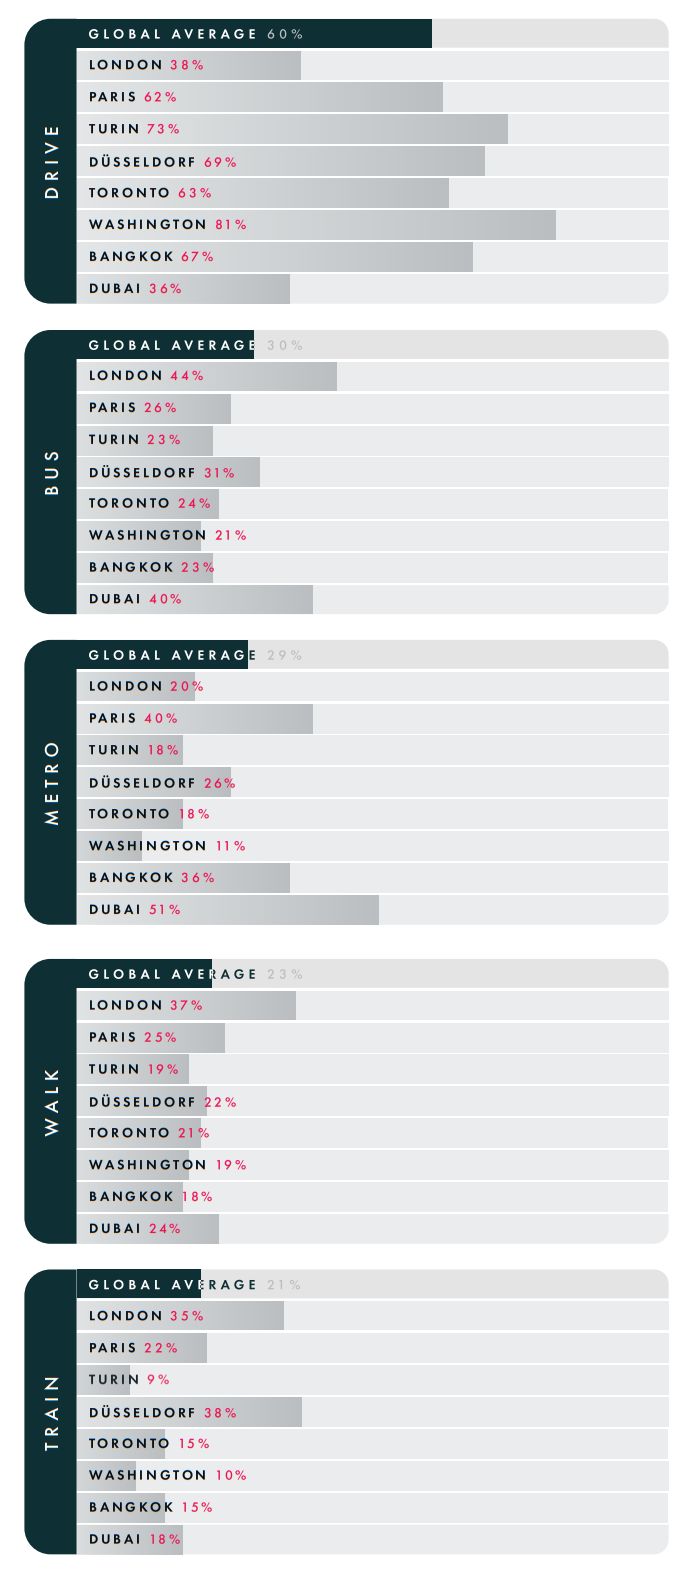
Figure 1: How respondents choose to commute [Source: page 3 of
Hitachi Rail report "Better Connected: Global attitudes to
Smart Public Transport"]
Having considered the preferred methods of commuting transport, the report goes on to consider how these habits have changed since the COVID-19 pandemic (see Figure 2, below). Somewhat surprisingly, the vast majority of respondents indicate that the COVID-19 pandemic has changed how they now travel. A significant proportion of the respondents who indicated they drive to work in the previous section may therefore have changed their commute habit as a direct result of the COVID-19 pandemic. As acknowledged by the report, this is an ever-evolving area, and many of the respondents who indicated that they had changed their habits in response to the COVID-19 pandemic also indicate that they expected these habits were likely to change again. Habits of respondents in Bangkok and Dubai were the most likely to have changed, whilst those in London (along with Paris, Turin and Washington) were comparatiely less likely to have changed. The answers here suggest that the COVID-19 pandemic may have had a surprisingly deterimental effect on the willingness of respondents to use public transport (seemingly to the deteriment of global decarbonisation objectives.)
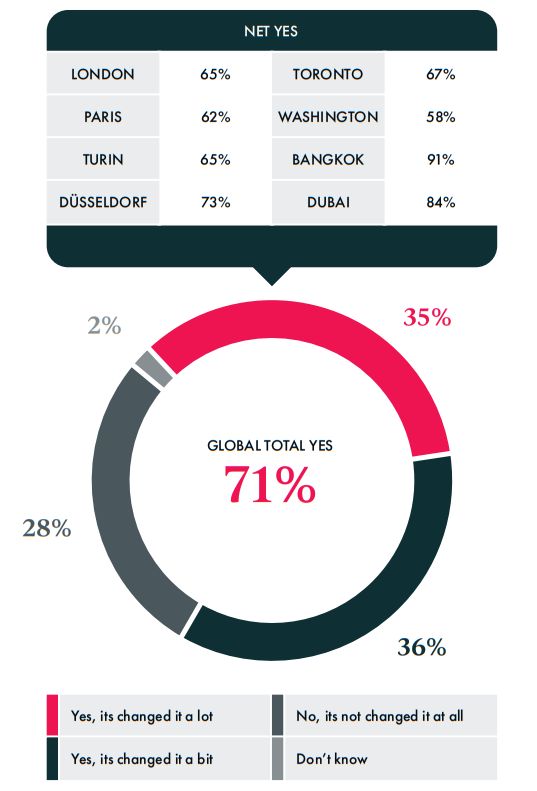
Figure 2: Has the pandemic changed how you travel now [Source: page
4 of Hitachi Rail report "Better Connected: Global attitudes
to Smart Public Transport"]
The report then goes on to consider barriers to using public transport. It will likely come as no surprise that respondents cited concerns around reliability and comfort as having influened their decision to drive as opposed to use public transport. In particular, a desire to avoid crowded services, likely at least partly attributable to our experiences during the COVID-19 pandemic, is cited as one of the primary drivers motivating respondents to use their own personal transport. As identified by the report, the desire for respondents to be both more comfortable and to avoid overcrowding could likely influence key areas for innovation if the general public's use of, and perspective of, public transport is to be improved in the future. Improved monitoring of services (including user numbers on trains and metro services,) and improved reliability would therefore appear to be areas primed for innovation in the coming years.
A potential difficulty identified in improving at least some of the customer experience of using public transport is a relative reluctance of respondents, in some cities, to provide personal details, such as payment details, in travel apps. As shown in Figure 3, below, somewhat surprisingly, London is one of the worst performers in this regard, having a comparatively low willingness to provide such information, with only Washington and Toronto being less willing to provide such details.
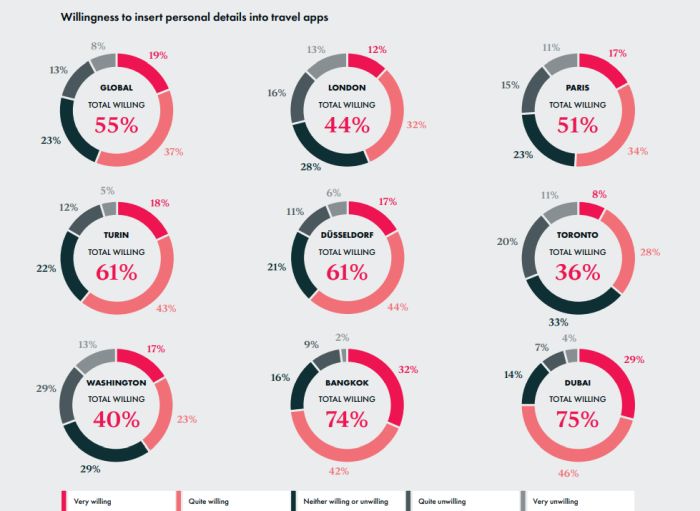
Figure 3: Willingness to provide personal details in travel apps
[Source: page 8 of Hitachi Rail report "Better Connected:
Global attitudes to Smart Public Transport"]
Three stand-out factors, shown in Figure 4 below, that respondents indicated were most likely to encourage them to use public transport are refered to as "the three C's": convenience, comfort and cost. Whilst perhaps not too surprising, these three factors appear to give both government and innovators clear targets to aim for if the general public are to be encouraged to increase their use of public transport in an effort to meet global decarbonisation targets.
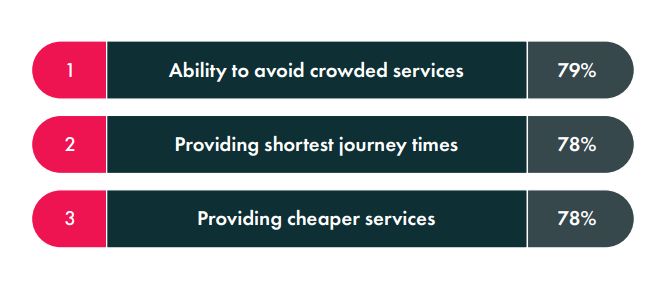
Figure 4: Three common themes likely to increase public transport
usage across the eight cities [Source: page 6 of Hitachi Rail
report "Better Connected: Global attitudes to Smart Public
Transport"]
It is clear from the report that challenges are faced, by governments and innovators alike, in encouraging commuters to use public transport. However, some clear trends emerge, providing innovators with opportunities to respond to the ever-changing needs of the general public across the globe. Intellectual property will continue to play an important role in protecting these innovations. Please do not hesitate to get in touch should you have any intellectual property queries falling within the transport sector or in any other technology area.
The content of this article is intended to provide a general guide to the subject matter. Specialist advice should be sought about your specific circumstances.