

IP Australia has released the twelfth edition of the Australian Intellectual Property Report 2024 (the Report) which presents key movements in IP statistics and explores the links between innovation, collaboration and commercialisation.
The Report presents and discusses the latest IP statistics across the range of categories administered by IP Australia, and is aimed at promoting awareness of IP rights. This year it also looks at two new areas of research – the correlation between patenting and an organisation's inclination to form partnerships that drive further development and investment, and evaluates the variation between patent scope in Australia, the EU and the US.
With innovation and increased IP filings as a key indicator of a healthy and competitive economic environment and outlook, it is positive to note that after a period of consistent decline and despite persistent inflation and interest rate rises, the number of Australian IP applicants increased in all IP categories in 2023.
Our team discusses the key findings and changes in trends.
IP statistics in Australia
In 2023, overall filings in trade mark and designs had strong growth after a sharp downturn in 2022, increasing by 7.2% and 11.5% respectively, while standard patents and plant breeder's rights experienced slight decreases, falling by 2.4% and 1.7% respectively.
Following significant decreases in Australian domestic applicants across all IP filings in 2022, Australian applicants increased significantly in 2023.
The Report notes:
"IP rights remain a driver of innovation in corporate scientific research by helping firms to commercialise their innovations. However, IP rights have added significance in an innovation system which relies on linkages between different players, such as universities, startups and corporations. First, IP rights facilitate technology trade, allowing universities and startups to trade their ideas and access the commercialisation capabilities of others. Second, by protecting innovations from imitation, IP rights provide young and small firms the time often needed to build commercialisation capability. ... Innovation is a key lever for raising overall welfare and wellbeing. The Australian IP Report offers insights into the dynamic interplay between IP rights, innovation and the broader economy."
2024 Australian Intellectual Property Report, pg 6
Patents
Standard patents
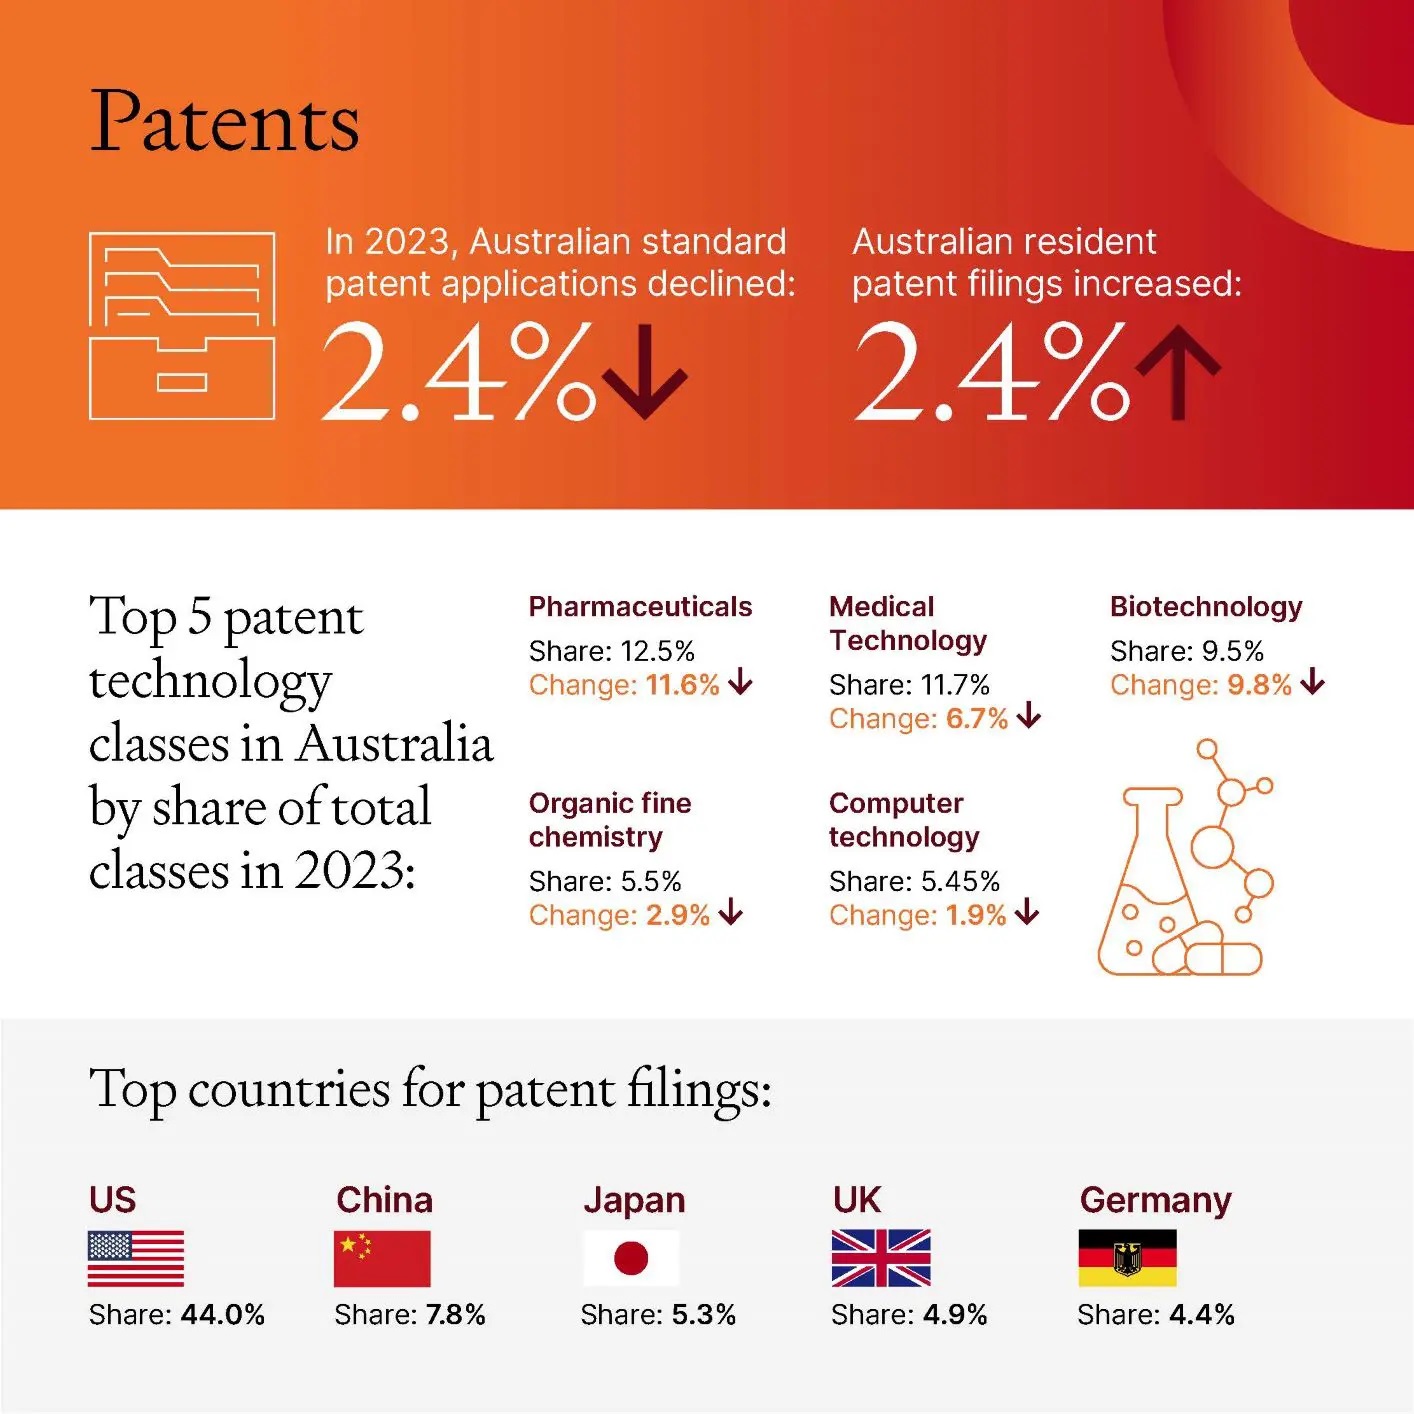
IP Australia received 31,515 standard patent applications in 2023, which is a slight decrease of 2.4% from 2022. The number represents an ongoing decrease in filings from the record level in 2021.
The data also confirm that national phase entry from PCT applications is the preferred filing route, with 22,929 national phase entries and around 8,500 direct entries recorded last year. While non-resident filings decreased by 2.8% in 2023, they still account for more than 90% of all applications filed in Australia. On the other hand, applications filed by Australian residents increased by 2.4%.
Countries of origin
The United States the largest contributor with 44.0% share of total applications, followed by China (7.8%), Japan (5.3%), the United Kingdom (4.9%) and Germany (4.4%). Notably, standard patent applications originated from China increased by 13.1% while the filings from US decreased by 5.9%.
Provisional applications
After persistent decline in the filing of provisional applications over the past decade, the number of provisional filings increased by 5.2% to 4244 in 2023. However, this number still represents over 20% decline compared to the provisional filings in 2011.
The authors of the Report note that the decline in provisional filings is mostly driven by a reduction in filings by individual applicants, and filings by large organisations and SMEs have remained relatively stable over the past decade.
Technology classes
The five leading classes for standard patent applications in 2023 were Pharmaceuticals at a 12.5% share of total applications, followed by Medical technology (11.7%), Biotechnology (9.5%), Organic fine chemistry (5.5%) and Computer technologies (5.5%). After consecutive years of significant growth from 2020 to 2022, pharmaceutical, medical technology and biotechnology patent applications all experienced decreases in 2023 by 11.6%, 6.7% and 9.8% respectively. Their declines likely reflect that the urgent needs created by the COVID-19 pandemic have eased.
Leading applicants (international and domestic)
The top five international patent applicants were LG Electronics with 196 applications, followed by Huawei Technologies (180), Becton Dickinson And Company (151), Caterpillar (139) and Nestlé (135), while the top five domestic applicants were Aristocrat Technologies Australia (73), CSIRO (54), Canva (48), Thanh Tri Lam (42) and Breville (22). Notably, filings by Canva Pty Ltd increased by more than 100% from 23 in 2022 to 48 in 2023.
Domestic activity – SMEs
Around 2,200 employing SMEs held an enforceable Patent, representing a mere 0.22% of employing SMEs in operation in Australia by the end of the 2023 financial year. The SME share of resident filings has been increasing steadily over the past decade, from 57.9% in 2014 to 62.9% in 2023, and private inventors account for an additional 22.1%.
Overseas applications
A total of 9,045 overseas patent applications were filed by Australian inventors in 2022, down by 3.1% from the 2021 level. The most popular destination for Australian applicants seeking overseas patent protection is the United States with a 38.5% share of total applications, followed by the European Patent Office (11.1%), China (7.2%), New Zealand (7.1%) and Japan (6.3%).
Collaboration and commercialisation
The Report finds that the number of Australian SMEs holding patents has increased at 5 times the rate of the total number of SMEs in the economy. It is also reported that Australian start-ups that employ a recent PhD graduate in their first year are 9 times more likely than the average new firm to be granted a patent, and those firms that have been recently granted patents are more likely to form collaborations including joint R&D and joint commercialisation arrangements.
The Authors of the Report also recognise an increasing division of innovative labour, "with many successful innovations relying on basic research by universities, startups who contribute to identifying its commercial applications and large firms who acquire and scale innovative ideas and practices."
Patent scope
The Report examines the scope of granted patents in Australia, which is an important factor that determines the patent's economic impact.
"Broader patents, such as those for more general discoveries or ideas, can spur cumulative investment within patenting firms, as pioneers seek to build on their own discoveries. Conversely, narrower patents increase the likelihood that others – such as a patentee's rivals – can design around the patent without infringing it and contribute to improving a technology."
2024 Australian Intellectual Property Report, pg 24
It is found that Raising the Bar Act 2012 contributed to the reduction of the likelihood of Australian patents being broader than their international equivalents. As of 2019, around 51% of Australian patents are estimated to be similar in scope to their international equivalents, around 35% are estimated to be broader, and around 14% are estimated as narrower.
Trade Marks
Trade mark applications and registrations
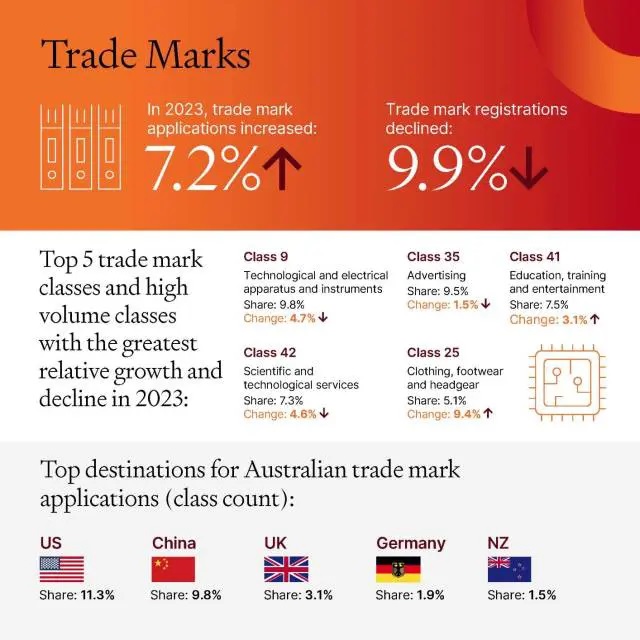
In 2023, 84,476 trade mark applications were received by IP Australia, which represents a 7.2% increase from 2022. Almost 80% of the applications in 2023 were direct applications, as opposed to applications through WIPO's Madrid route.
Resident filings increased by 9.8% and continued to hold a relatively higher share of trade mark applications (58%) in 2023 when compared to non-residents. In the meantime, trade mark registrations experienced a decline of 9.9% in 2023.
Countries of origin
Non-residents continued to hold a lower share of trade mark applications (42%) in 2023 when compared to residents. The leading foreign countries of origin were the United States with a 11.3% share of total applications, followed by China (9.8%), the United Kingdom (3.1%), Germany (1.9%) and New Zealand (1.5%). Notably, applications originated from China increased by more than 50% in 2023.
Trade mark classes
The five classes in the Nice Classification system that received the most applications in 2023 were: Technology and electrical apparatus and instruments with a 9.8% share of total classes, Advertising (9.5%), Education, training and entertainment (7.5%), Scientific and technological services (7.3%), and Clothing, footwear and headgear (5.1%).
Leading applicants (international and domestic)
The top five international applicants were Novartis Ag (107), L'Oréal (98), Lidl Stiftung & Co Kg (92), Zhongxian Zhang (91), and Apple Inc (89), while the top five domestic applicants were Aristocrat Technologies Australia (91), Cannatrek Group (72), Ainsworth Game Technology (71), Endeavour Group (66), and Pharmacor (55).
Domestic activity – SMEs
SMEs accounted for 73.7% of all resident trade mark filings in 2023, while individuals accounted for 25.5% of resident filings. The share of employing SMEs operating in Australia that hold a trade mark increased slightly between 2022 and 2023, from 4.12% to 4.38%.
Overseas applications
A total of 20,685 overseas trade mark applications were filed by Australian applicants in 2022, which represented a decline from the level of 2021 by 10.3%. The most popular destination for Australian applicants seeking overseas trade mark protection is the United States with a 14.8% share of total applications, followed by New Zealand (14.2%), China (13.1%), the United Kingdom (9.6%) and Europe (7.4%).
Designs
Design applications, registrations and certifications
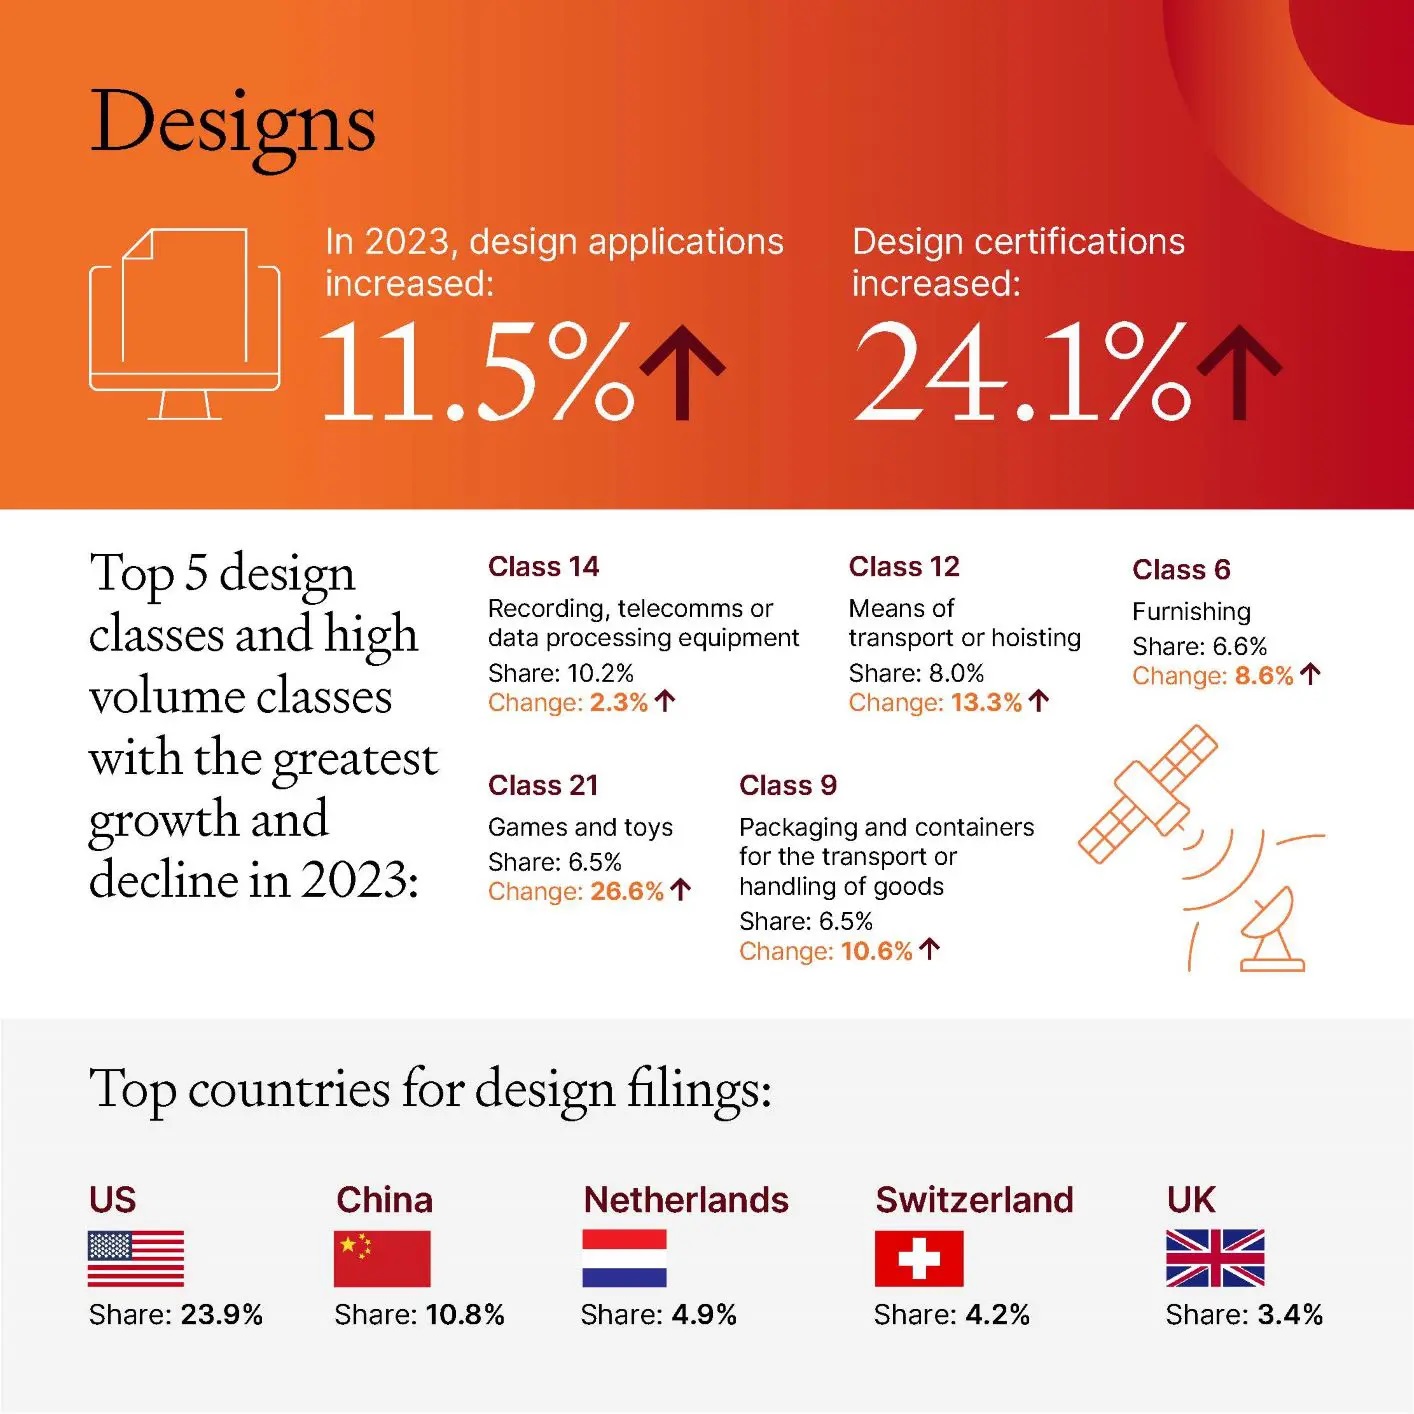
A record number of 8,776 design applications were filed in 2023, which is a 11.5% increase over the previous year. Number of design registrations increased by 5.4% in 2023 to 8,000, and 1,540 designs were certified in 2023, representing a significant 24% increase from the previous year.
Resident filings increased by 24.2% to 2,652 in 2023, but the number represents less than a third of all design applications.
Countries of origin
The leading countries of origin were the United States with a 23.9% share of total applications, followed by China (10.8%), the Netherlands (4.9%), Switzerland (4.2%) and the United Kingdom (3.4%) in 2023. Notably, significant growths are seen in applications originating from Switzerland (61.7%) and from the Netherlands (164.6%).
Design classes
The five classes in the Locarno Classification system that received the most applications in 2021 were: Recording, telecommunication or data processing equipment, with a 10.2% share of total classes, followed by Transport (8.0%), Furnishing (6.6%), Games (6.5%) and Transport packing and containers (6.5%).
Leading applicants (international and domestic)
The top five international applicants were Vidaxl Ip Bv (268), Apple Inc (181), Cartier International Ag (99), Miss Amara Group (82) and Dr Ing Hc F Porsche Aktiengesellschaft (71), while the top five domestic applicants were Cube in Cube Design & Drafting (48), Systems Ip (42), Andrew Plim (32), Schneider Electric Australia (29) and Bailey Interiors (27).
Domestic activity – SMEs
SMEs filed 68.7% of domestic design filings in 2023, with individuals responsible for a further 23.6%.
Overseas applications
A total of 2,625 overseas design applications were filed by Australian applicants in 2022, a decline of 12.5% from their record level of 2021. The most popular destination for Australian design innovators is the United States with a 21.7% share of total applications, followed by Europe (16.3%), the United Kingdom (14.1%), China (11.4%) and New Zealand (10.6%). Notably, a decrease of 47.4% was recorded in Australian residents seeking deign protection in the United Kingdom.
Plant Breeder's Rights
PBR applications and registrations
In 2023, 296 PBR applications were filed, which accounted for a 1.7% decline from 2022. Non-residents filings fell by 17.5% but continued to hold a relatively higher share of PBR applications (51%) in 2022 when compared to residents.
In the meantime, PBR registrations rose sharply by 58.5% compared to the 2022 level, recording another above 50% increase after the 2022/2021 growth (50.9%).
Countries of origin
The leading countries of origin were the United States with a 13.9% share of total applications, followed by the Netherlands (10.5%), Switzerland (5.7%), France (4.4%) and Denmark (2.7%) in 2023.
PBR classes
The five classes that received the most applications in 2023 were: Ornamentals with a 29.9% share of total applications, followed by Fruit crops (25.2%), Field crops(non-cereals) (14.6%), Field crops (cereals) (10.6%), and Vegetable crops (10.2%).
Leading applicants (international and domestic)
The top five international applicants were Syngenta Crop Protection Ag (17), Driscolls Inc (9), Knud Jepsen As (8), Rijk Kwaan Zaadteelt En Zaadhandel Bv (7) and Eden Collection Bv (6) while the top five domestic applicants were Plant Growers Australia (26), Ozbreed Greenlife (15), Oz Pash (9), Australian Grain Technologies (8) and Botanic Gardens And Parks Authority (8).
Copyright
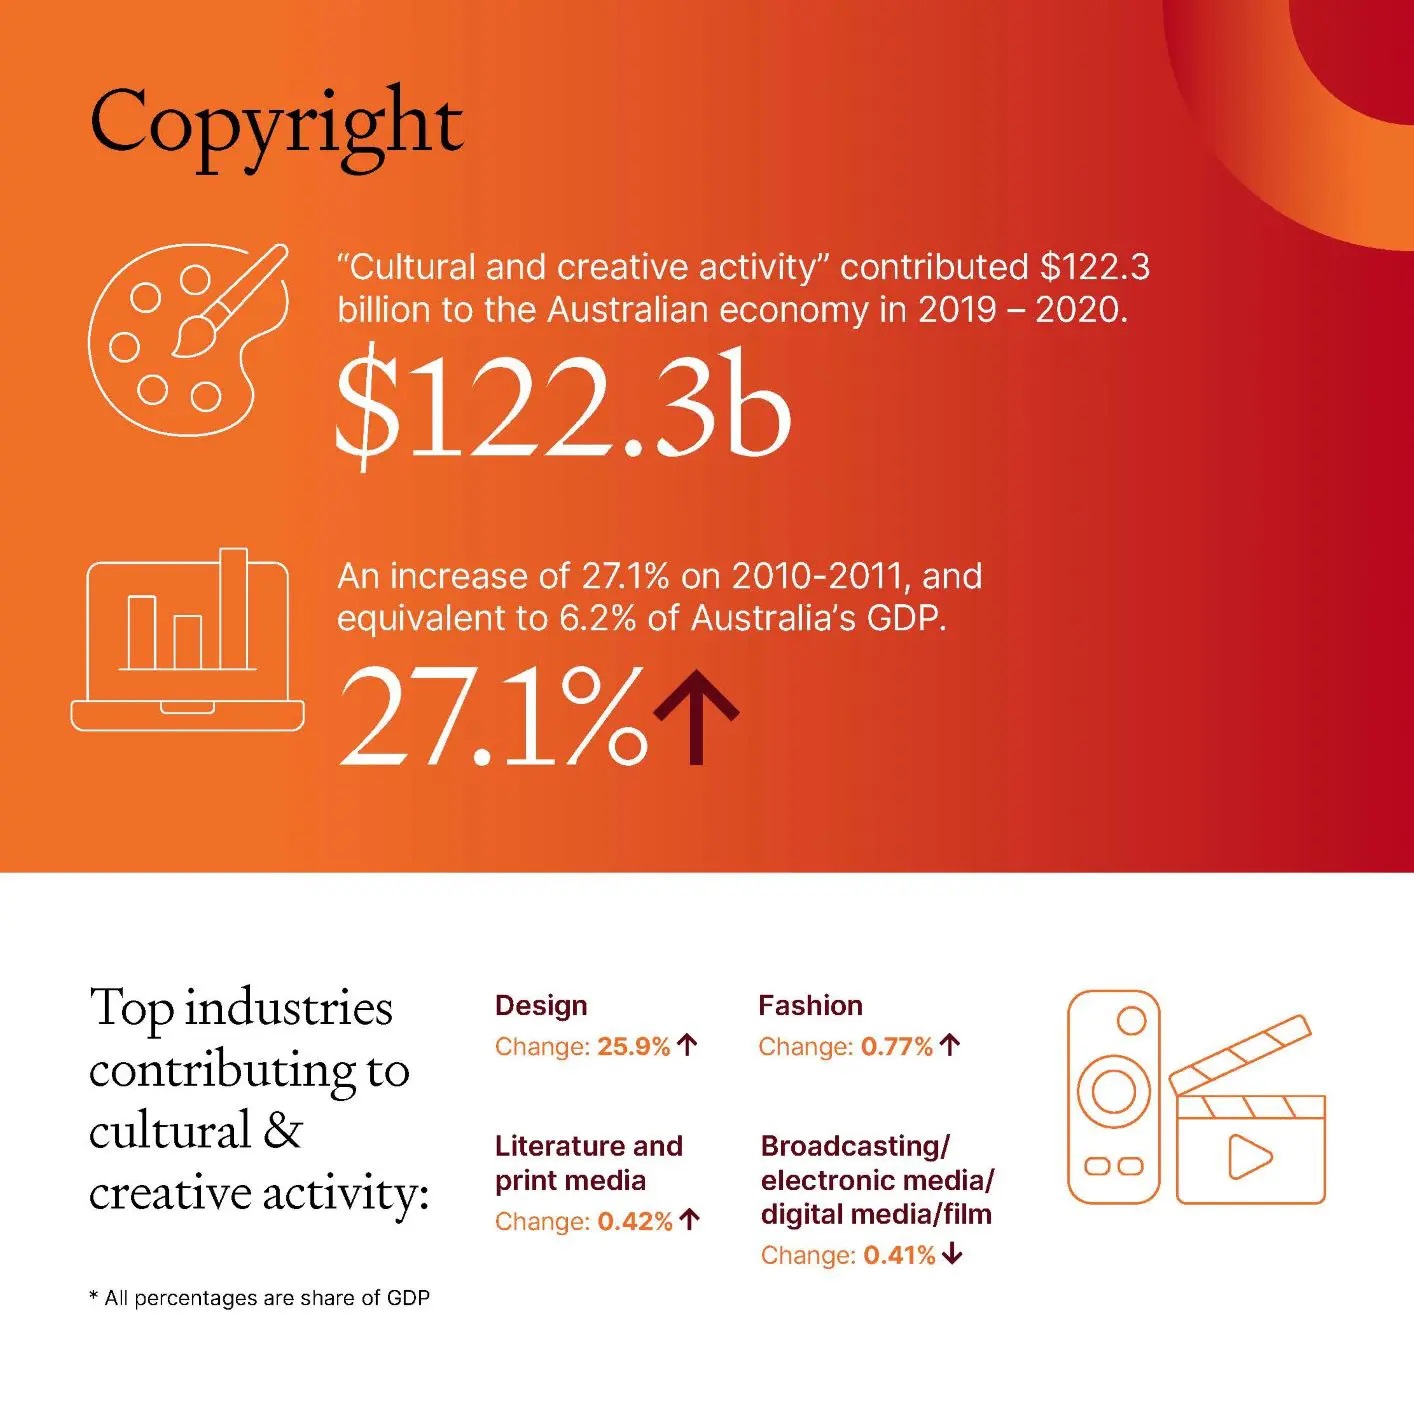
The Report notes that "cultural and creative activity" contributed $122.3 billion to the Australian economy in 2019 – 2020, which was 27.1% higher than that in 2010-2011.
The Report also confirms the extensive level at which copyright material is used.
For example, in 2022 – 2023, copyright owners in the music industry received a total of $474 million. Further, $142 million in revenue was distributed to more than 36,000 rights holders including writers, artists, publishers and agents by Copyright Agency Limited (CAL). $48.7 million was distributed to registered artists and licensors by the Phonographic Performance Company of Australia (PPCA), and $40.3 million was distributed to over 5,100 copyright owners in the audiovisual sector such as producers, directors, broadcasters and agents.
Research program
Apart from the statistics, the report also details IP Australia's research programs. The three main programs include: the Office of the Chief Economist (OCE), the Centre of Data Excellence (CODE), and the IPAVentures. These programs accomplish many things, for example: the OCE investigates the impact of IP policies and activities on Australian businesses and economy; the CODE analyses, presents and reports data across all IP rights; the IPAVentures aims to support the IP Australia's vision of creating a world-class IP system and promoting prosperity for Australians.
The Report, and these programs, are well worth a more detailed review for interested parties.
Reach out to the team
For all of your IP advice, filing, strategy, prosecution and legal needs, Spruson & Ferguson has experienced IP and industry experts across all areas of science and technologies, offering you and your business 360° protection. Connected as one firm across 10 offices in the APAC region, our clients can file in over 25 jurisdictions with a single instruction.
The content of this article is intended to provide a general guide to the subject matter. Specialist advice should be sought about your specific circumstances.