

Relationships can be tough, even under normal circumstances.
However, in the last few years, we have all had to deal with some pretty extraordinary circumstances.
The recent Covid-19 pandemic turned the lives of people all over the world upside down. Here in Australia, much of 2020 and 2021 was spent in lockdown, particularly in the two largest cities here – Melbourne and Sydney.
These strict lockdowns meant that many couples were required to work from home, as well as home school their children. As if that didn't add enough pressure to our lives, many people also had to deal with additional financial stress from the loss of jobs and businesses.
With lockdowns and restrictions on gatherings, particularly during 2020 and 2021, the number of marriages was artificially suppressed and this can be seen in the latest statistics on marriage and divorce released by the Australian Bureau of Statistics in December 2023.
With this latest release of the Australian Bureau of Statistics marriage and divorce stats now available and the latest Finder stats on hand, we've put together a summary on the key findings of marriage and divorce rates from the report.
Marriage Rate in Australia
After two years of fewer marriages, in 2022, the number of marriages and the crude marriage rate in Australia grew significantly.
The crude marriage rate reflects the number of marriages registered during the year per 1,000 people of the estimated resident population over the age of 16 in Australia. During 2020 the marriage crude rate dropped to 3.8 from 5.6 in 2019, and in 2021 it rose slightly to 4.3. In 2022, the crude marriage rate jumped to 6.1, which while a large increase from the previous two years, is still in line with the pre-pandemic years which can be seen in the table (1.1) below.
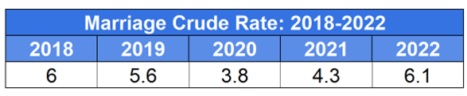
Table 1.1: depicting marriage crude rate for
2018-2022.
>How Many Australians are Married?
While it might feel like married couples are everywhere and every person in the country is in a committed relationship, the statistics show otherwise. Finders' article on marriage statistics shows that just over half (56%) of Australia's adult population is either married or partnered up.
Of the people in the relationships or marriages, the data shows that 59% of the male population are married or in relationships, and 53% of the female population are in marriages or relationships.
With less women likely to be in relationships or marriages, the statistics show that 30% of the female population of Australia have never been married, 9% are divorced, 3% are widowed and 3% are separated.
In terms of age groups, generations, and geographical information for marriages in Australia, the data is as follows:
- The median age of marriage has risen slightly over the last five years – the median age at marriage for men is 32.5 years and for women the age is 30.9. You can view these details in table 1.2 below.
- The generation mostly like to be married or partnered is the Baby Boomers, with 64% of this generation in a marriage or relationship.
- The generation least likely to have ever been married is Gen Z, with 61% of Australian Gen Z's never having been married.
- 59% of the adult population in South Australia is married or in a relationship, the state with the highest proportional number of marriages.
- Victoria has the most single adults with 32% of the adult population having never been married.
- New South Wales and Victoria had a huge increase in the number of marriages in 2022 compared to the previous years, with a 65% increase for NSW and 77% increase for Victoria. Further information available in table 1.3 below. This increase can be attributed to the effects of the Covid-19 lockdowns and gathering restrictions of 2020 and 2021 which saw the postponement of many marriages.
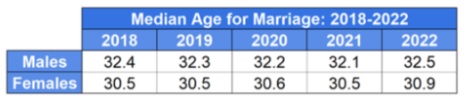
Table 1.2: median age for marriage
2018-2022
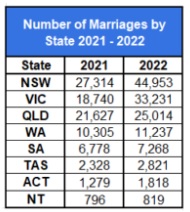
Table 1.3: number of marriages by state
2021-2022
How many people get married each year in Australia?
As we touched on earlier, the number of marriages during the pandemic years of 2020 and 2021, was artificially suppressed by restrictions on gatherings and lockdowns. This makes it tough to draw true comparisons to the years before and 2022.
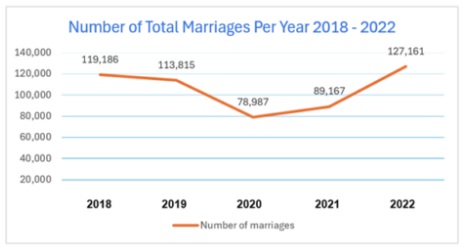
Table 1.4: total number of marriages in Australia
2018-2022
In 2022 the number of marriages in Australia was at an all-time high of 127,161, this was up from 89,167 in 2021 and 78,987 in 2020. The number of marriages in 2020 was an historic low, and a drop of 30% compared to 2019 when there were 113,815 marriages registered.
In the years prior to the covid-19 pandemic, the number of marriages each year was trending downwards slightly, with numbers falling between 110,000-120,000 marriages each year. Taking into consideration the number of marriages that occurred in 2022 that would have likely been postponed during the pandemic, it's unlikely that the number of marriages each year will continue to rise. However, this is speculation and only statistics over the next few years will be able to show the true trends.
Marriage trends through the years
As we discussed above, the number of marriages over the years was starting to decline in the last 10 or so years. Though the Covid-19 pandemic makes it difficult to determine whether this gradual decline would have continued for sure, it's important to note that the attitudes towards marriage have changed and some people deem it unnecessary. We will discuss this further shortly.
While the pandemic had a direct impact on marriages in Australia, one thing that seemed to return to normal in 2022 was the seasonal marriage pattern where the peak number of marriages occurred during Spring (October) and Autumn (April). The most popular day of the year to get married in 2022 was October 22nd.
Keep reading for some more marriage trends.
Average marriage length in Australia
Every now and then we hear about celebrity marriages that last only days, and while the social stigma associated with divorce has certainly decreased over time, the duration of marriage in Australia has actually increased gradually over the last five years. The average length of marriage in Australia in 2022 was 12.8 years, up from the average marriage length previously being 12.2 years in 2019.
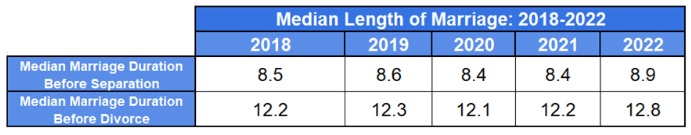
Table 1.5: median length of marriage
2018-2022
The increase in marriage length has actually been an ongoing trend, though the increase has been minor. In 1999, the average marriage duration was just under 12 years at 11 years and 9 months.
Less people are getting married
Over the years, there has been a fundamental shift in social attitudes towards marriage in Australia. In mainstream Australian society there has been an almost total erosion of the social stigma attached to "living in sin". Today, couples regularly live together and co-parent children outside marriage.
There is also less practical pressure on couples to marry, as a committed couple has much the same legal and social rights as a married couple. For instance, a de facto couple is able to access the same property rights as a married couple and is also able to access similar (although not identical) social security and taxation benefits.
Earlier we discussed the marriage crude rate (the number of marriages per 1,000 adult Australians), and while it increased in 2022, it had gradually been declining in recent years. The changes to society's views on marriage are truly reflected in the crude marriage rate if we look a little further back in history. In 1970, the crude marriage rate was 9.6, compared to now at 6.1.
The reduction in the number of marriages and the marriage rate could be attributed to there being more socially acceptable alternatives to marriage, which we will discuss below.
More alternatives to marriage
In contemporary Australian society, the landscape of personal relationships has undergone and continues to undergo a transformation, with traditional marriage no longer being the sole pathway to long-term commitment. Below, we will explore the growing popularity of alternatives such as cohabitation before marriage, partnerships, and de facto relationships.
Cohabitation before marriage
Cohabitation, or living together without the formalities of marriage, has become a common step in modern relationships. This arrangement allows couples to experience day-to-day life with their partner before deciding on marriage.
It's seen as a practical approach for testing compatibility, sharing financial responsibilities, and fostering deeper emotional bonds. The gradual transition from cohabitation to marriage, for many, represents a more organic development in the relationship, often resulting in stronger marital foundations.
Partnerships
Beyond cohabitation, the concept of partnerships has also gained traction. These partnerships, often equated with romantic relationships, do not necessarily lead to marriage but are based on mutual respect, love, and commitment.
Such arrangements may or may not involve living together, but they emphasise emotional and practical support. Partnerships acknowledge the evolving nature of relationships, where personal growth, career aspirations, and individual freedoms are as important as the relationship itself.
This form of union respects the autonomy of each individual while maintaining a committed bond.
De Facto Relationships
De facto relationships hold a significant place in Australian society as an alternative to traditional marriage.
Legally recognised, these relationships are akin to marriage but without the formal ceremony. Couples in a de facto relationship live together on a genuine domestic basis and have their relationship acknowledged by various legal statutes. This recognition provides many of the same rights and responsibilities as marriage, covering aspects like property distribution, financial agreements, and child custody.
De facto relationships reflect a societal acknowledgment of diverse relationship structures, offering legal security and societal acceptance without the traditional bounds of marriage.
Same sex marriage
The legalisation of same sex marriages occurred in recent history – in December of 2017. While the legalisation of gay marriage in Australia also saw recognition of marriages being valid that were performed overseas, as same sex marriage has only been legal for a relatively short period of time, and two years of this time includes the Covid-19 pandemic, it's difficult to draw conclusions based on the data.
Over the next few years, we should be able to see some trends emerge, however some key things to note include:
- The number of same sex marriages that occurred in 2022 was up significantly compared to 2020 and 2021, with 1,767 males married in 2022, and 2,667 females married in same sex marriages.
- There was a significant reduction in the number of same sex marriages due to covid-19, however, unlike the total number of marriages being higher in 2021 compared to 2020, when it comes to same sex marriages, the number of marriages that occurred in 2020 was higher than in 2021.
- 2018 was the first full year of same sex marriage being legal in Australia and is the year with the highest number of same sex marriages, with 2,757 male marriages and 3,784 female marriages.
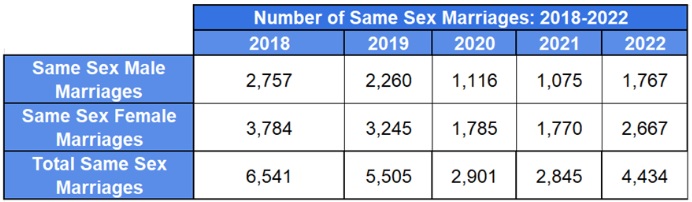
Table 1.6: number of same sex
marriages
Other marriage stats
It's somewhat common for someone to have lived with an ex-partner
When a relationship ends, while it's common for people to move out and no longer live together, in Australia, there's still a significant minority of people living with an ex-partner after the relationship breaks down.
This is referred to as living separated under one roof and commonly occurs for practical reasons, such as child care, staying until the end of a lease or until a property is sold, or because of financial pressure.
A Finder survey of 1,010 respondents found that 4% of Australians are currently living with their former partner or spouse, and 15% have previously lived with an ex-partner to save on housing costs or avoid a costly move. That is equivalent to roughly 3.6 million people who have lived under the same roof with an ex-partner despite the probable discomfort this would cause. Millennials (26%) are the most likely to have continued living with an ex-partner, followed by 21% of generation Z. This is compared to 96% of baby boomers who have never stayed living with an ex-partner for any reason.
And while we're on the subject of financial strain, Finder data has also shown that pressures from the cost of living increases we've seen in the last couple of years has put significant strain on relationships.
358 people responded to a Finder survey, that the cost of living had put pressure on their relationship in last 12 months, with 25% of these people saying that they had lied to their partner about spending, 13% of these people had continued to live with their ex due to the cost-of-living financial pressure, and 8% had restarted a relationship with an ex to cope with increased costs.
10.80% of marriages are second marriages
In 2021, 10.80% of marriages were between couples both of whom had previously been married before and were bravely taking the plunge again.
A further 14.90% of marriages involved one spouse who was entering into their second marriage.
Unfortunately, when it comes to second marriage divorce rates, statistics are not on your side – with a second (or third) marriage being more likely to fail than a first marriage. In fact, up to 60% of second marriages will also end in divorce. Below are some more details of previous marital status and marriages.
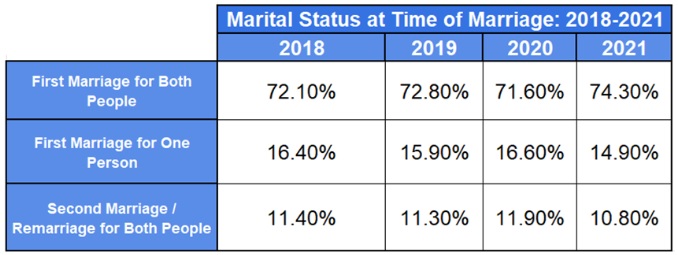
Table 1.7: marital status at time of marriage
2018-2021
Divorce rates in Australia
Of course, statistics cannot convey a full picture of what happens to families impacted by divorce. Behind every one of the following numbers, there are two people who, almost certainly, set out with high hopes for a committed and joyful marriage.
Some divorces are a welcome relief to both parties, but divorce can often be one of the most painful and disruptive experiences of an individual's life.
While there is less stigma associated with divorce in Australia these days, the number of divorces and the crude divorce rate has been on the decline for the last 20 years, with the exception of 2021.
Let's discuss this and other divorce statistics and trends below.
Annual Divorce Rate
The introduction of the Family Law Act 1975 allowed no-fault divorce system in Australia. This meant that from January 1976, people didn't need to prove that their spouse was at fault for their divorce, rather, they needed to prove that the relationship had irretrievably broken down.
The changes to the Australian divorce system meant that in 1976, the family court granted the highest number of divorces ever, which was more than 60,000 divorces finalised. The crude rate for divorce was also highest that year at 4.6. This peak was due to the change of the laws, and it meant that many people who were trying to divorce but didn't have the correct proof or grounds for divorce were able to do so. In the years that followed, the divorce rate dropped significantly, though remained higher than it had prior to the law changes.
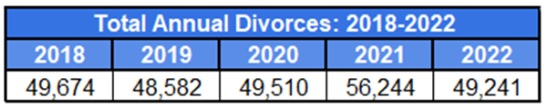
Table 1.8: total number of divorces annually
2018-2022
In 2022, according to the latest ABS statistics on divorce, the number of divorces granted in 2022 was 49,241 – this was 12.45% less than 2021 which saw 56,244 divorces finalised. The number of divorces in 2022 was more in line with the number of divorces in the years 2018,2019, and 2020. The increase in the number of divorces in 2021 is not unexpected and largely attributable to the fact that lockdown of 2020 and 2021 placed pressure on many relationships but also because there was a change to the way divorces were processed and it meant that divorces could be processed faster.
Interestingly, since the early 2000s the number of divorces granted and the divorce rate has declined. The number of divorces has tended to sit between 45,000 and 50,000, while the divorce crude rate has dropped to being between 2.0 and 2.5 (2.4 in 2022). The crude divorce rate in recent years, excluding 2021, has been at a similar level to what it was in 1975. The year prior to the changes in divorce law.
The general decline in the number of divorces in Australia is likely due to the decline in the number of marriages and people choosing to turn to other marriage alternatives, like de facto relationships.
An important statistic to note is that as a result of the pandemic and lockdowns, statistics from the Separation Guide show a 314% increase in the number of couples thinking about separating during lockdown.
Divorces by state
The number of divorces by state decreased between 2021 and 2022, with all states seeing a slight decrease. As the crude divorce rate and number of divorces has been decreasing gradually over time, with the exception of 2021, the generally trend seems to be continuing. As we mentioned above, the number of divorces declining could be as a result of less marriages occurring and social attitudes changing, or that when people are marrying, they are deciding to do so at an older age.
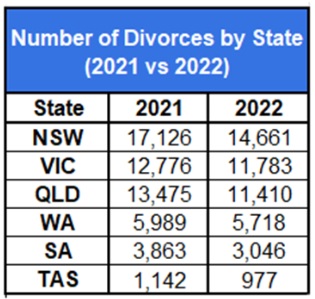
Table 1.9: divorces by state
2021-2022
Second marriage divorce rate
As we touched on above, 10.8% of marriages in Australia are second marriages, and 60% of second marriages end in divorce.
Second marriages in Australia tend to have higher divorce rates due to a combination of factors. For example, individuals who have previously divorced might be more inclined to leave an unsatisfactory relationship, thus increasing the likelihood of a second divorce.
Certain character traits that contribute to marital instability may be more prevalent in those who remarry. Blended families with stepchildren can face unique challenges that put additional stress on the marriage.
Finally, financial pressures, often stemming from responsibilities related to previous relationships, can also play a significant role in straining second marriages.
Divorce Trends through the years
While 2021 saw a slight increase in the number of divorces, the divorce numbers have been pretty similar for the last 5 years and there are still a lot of long-term trends that can be identified. We will discuss some of these trends below.
>What year of marriage is divorce most common?
For couples who decide to divorce, the median duration of the marriage was 12.8 years in 2022. This is an increase from 12.2 years in 2021 and 12.1 years in 2021.
The median marriage duration to when couples decide to separate was 8.9 years in 2022, which was also an increase from 2020 and 2021, where the median duration was 8.4 years.
Divorces with children
Regarding the impact on children, the percentage of divorces affecting minors has decreased from 68% in 1975 to around 47% in 2014, with a slight increase to 48% by 2021. Data for 2022 was not included in the latest statistics release.
This gradual reduction reflects more divorces among couples whose children are already adults and broader social trends, including lower fertility rates and an increase in childless couples.
Divorce rates by age
Couples are now getting divorced when they're older. In 2022, the median age at divorce for men was 46.7 years, up from 45.9 years the year before. For women, the median age was 43.7 which is an increase from 2021 where the median age was 43.
The increase in divorce age for both men and women could be attributed to the fact that people are getting married at older ages, and the median marriage duration has slightly increased in recent years.
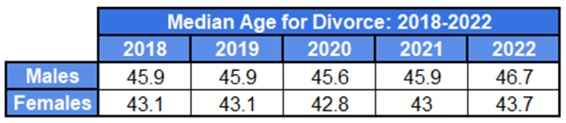
Table 2.0: median age for divorce
2018-2022
Divorce rates by gender
In terms of divorce rate by gender in Australia, women are more likely than men to be divorced, however, the latest statistics related to gender and divorce rate do not show the history of divorce rates.
Rather, the ABS data from 2021 shows us that the highest divorce by age crude rate for males was 10.3 for those aged between 40 to 44 years and 45 to 49 years. For females, the peak divorce rate by age was 10.4 and this was in the age range of 40 to 44 years.
For those aged below 45 years, the divorce rate was higher for females and for those aged over 45 years, the divorce rate was higher for males.
Initiated by women
Historically, women have initiated more divorce applications in Australia than men, however, with the introduction of joint applications for divorce, more than half of divorces in 2022 were initiated with a joint application.
According to 2022 data from the ABS, 12,730 females initiated divorces applications in Australia. This is a significant decrease compared to the previous 4 years, and a more rapid decline rate than males.
Initiated by men
While women historically have initiated more divorce applications than men each year, in 2021, for the first time in the 5 years previous, more males initiated divorce than females. However, in 2022, the trend of more females initiating divorce than males returned. However, for the first time, the number of joint applications for divorce was more than 50% of the total number of divorce applications.
With the rise of joint applications for divorce, being able to discern the person who has initiated the divorce will become increasingly difficult. In addition to this, with the legalisation of same-sex marriages and the inclusion of non-binary as a gender able to be recorded in marriages, the data will be impacted and whether this data is continued to be included is yet to be seen.
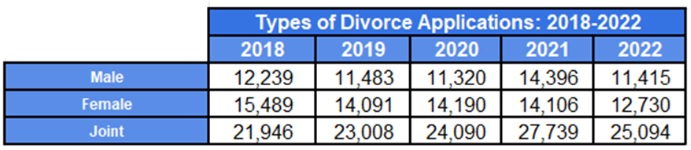
Table 2.1: types of divorce application
2018-2022
Where does Australia's divorce rate stand?
The rate of divorce in the world has risen over the last half century, but this rise has not been even, resulting in notable disparities between countries and regions of the world. The highest rate of divorce in the world is Russia with 4.8 per 1,000 people, while the lowest divorce rate is in Sri Lanka with 0.15 per 1,000 people.
The divorce rate in Australia sits in the mid point of this range, with 2.4 per 1,000 residents in 2022. This places Australia behind the United States at 2.5 divorces occurring per 1,000 people each year.
To learn more about global marriage and divorce statistics, read this article here.
Need free legal advice on divorce in Australia?
As we now face a cost of living crisis at the moment, it will be interesting to see how financial and business woes may also impact our marriage and divorce rate in Australia.
If you find yourself in a position where you and your spouse decide to separate and divorce, here at Unified Lawyers we understand how difficult it can be to contemplate divorcing a spouse, especially when there are children to consider.
